Welcome to this comprehensive guide designed specifically for beginners eager to learn about technical analysis in the realm of stock trading. This guide aims to demystify the concepts and tools used by traders to predict future price movements based on historical data and current trends.
Throughout this article, you will discover the essential principles that form the foundation of technical analysis. From understanding price charts to identifying patterns, this guide covers everything you need to know to get started. You will learn how this approach differs from other methods and why it has been a staple among traders for over a century.
By the end of this guide, you will have a clear roadmap for further learning and practical insights to enhance your trading skills. Let’s embark on this journey to empower your trading experience!
Key Takeaways
- This guide introduces the foundational concepts of technical analysis.
- Understand the difference between technical and fundamental analysis.
- Learn about core principles that guide price movements.
- Explore essential tools and indicators used in trading.
- Identify common chart patterns for trend analysis.
- Gain insights into risk management practices.
- Access resources for further learning and skill development.
Introduction to Technical Analysis for Stock Trading
This guide serves as a stepping stone for beginners looking to navigate the world of market analysis. Understanding how to interpret market data is crucial for successful trading. In this section, we will define what market analysis is, explore its benefits, and clarify the difference between stocks and companies.
What is Technical Analysis?
Technical analysis is defined as the extraction of information from market data into objective visualizations through mathematics. It emphasizes investor behavior and supply and demand to explain current conditions and anticipate future price paths in financial markets. In simpler terms, it involves studying market data to forecast future trends in prices.
This practice has roots that date back centuries. Early forms emerged in the 17th century with merchant Joseph de la Vega’s accounts of Dutch financial markets. Later, Japanese rice trader Homma Munehisa developed candlestick techniques in the 18th century. These methods evolved further through Charles Dow, who compiled and analyzed American market data in the late 1800s, laying the groundwork for what is now known as Dow Theory.
Why Use Technical Analysis in Stock Trading?
Market analysis is particularly valuable for stock trading. It helps traders time their entries and exits more precisely, identify trend reversals, and ride price momentum, regardless of a company’s underlying fundamentals. By focusing on the stock rather than the company, traders can make decisions based on observable price action and market data.
A critical insight for beginners is understanding that stocks and companies are distinct entities. A great company can be a poor stock if its price reflects slow growth, while a struggling company might trade at a high price for an extended period. This distinction makes market analysis essential, as it allows traders to navigate these complexities effectively.
Difference Between Stocks and Companies
Many novice traders may overlook the difference between stocks and companies. CEOs of struggling companies often promote potential turnarounds that may or may not happen. Conversely, CEOs of strong companies might overlook competitive threats, making pure fundamental analysis potentially misleading for timing trades.
By using market analysis, traders can develop an objective framework for making informed decisions based on actual market behavior. This approach has proven its value over time, with the New York Institute of Finance training thousands of professionals in these methods.
Understanding Price Charts and Candlestick Reading
Understanding the visual language of price charts is essential for anyone looking to delve into market analysis. Price charts serve as the primary tool for traders, allowing them to visualize price movements over time. This section will explore the various types of price charts, how to read candlestick charts, and the importance of selecting the right timeframes for effective analysis.
Types of Price Charts
Price charts come in several formats, each offering unique insights into market behavior. The most common types include:
- Line Charts: These charts display a single line that connects closing prices over a specific period. While they provide a clear view of price trends, they lack detail compared to other chart types.
- Candlestick Charts: These are the most informative charts, displaying five key data points: open, close, high, low, and direction of movement. This format is essential for understanding price action and identifying potential market reversals.
- Bar Charts: Similar to candlestick charts, bar charts show opening and closing prices, as well as highs and lows, but do so in a different visual format.
How to Read Candlestick Charts
Candlestick charts are particularly valuable due to the rich information they convey. Each candlestick represents a specific time frame and consists of a body and wicks. The body indicates the price range between the open and close, while the wicks show the high and low prices during that period.
Key candlestick patterns include:
- Hammer: A bullish reversal signal characterized by a green body, little to no upper wick, and a long lower wick.
- Shooting Star: A bearish reversal signal with a red body, minimal lower wick, and a long upper wick.
- Bullish Engulfing: Occurs when a green candle completely covers the previous day’s red candle range, indicating strong buying pressure.
- Bearish Engulfing: The opposite of the bullish engulfing pattern, where a red candle engulfs the previous green candle’s range, signaling potential downward movements.
Timeframes and Their Importance in Chart Analysis
Selecting the appropriate timeframe is crucial for effective chart analysis. Different trading styles require different timeframes:
- Day Traders: Often use 1-minute to 15-minute charts to capture quick price movements.
- Swing Traders: Typically analyze daily or weekly charts to identify medium-term trends.
- Long-Term Investors: May focus on monthly charts to understand broader market trends.
Understanding how to read price charts and candlestick patterns can significantly enhance your trading strategy. By recognizing support and resistance levels, traders can make informed decisions about entry and exit points. As you continue your journey in market analysis, consider using platforms like TradingView to practice your skills.
| Chart Type | Data Points | Usefulness |
|---|---|---|
| Line Chart | Closing Prices | Simple trend visualization |
| Candlestick Chart | Open, Close, High, Low | Detailed price action analysis |
| Bar Chart | Open, Close, High, Low | Similar to candlestick but different visual format |
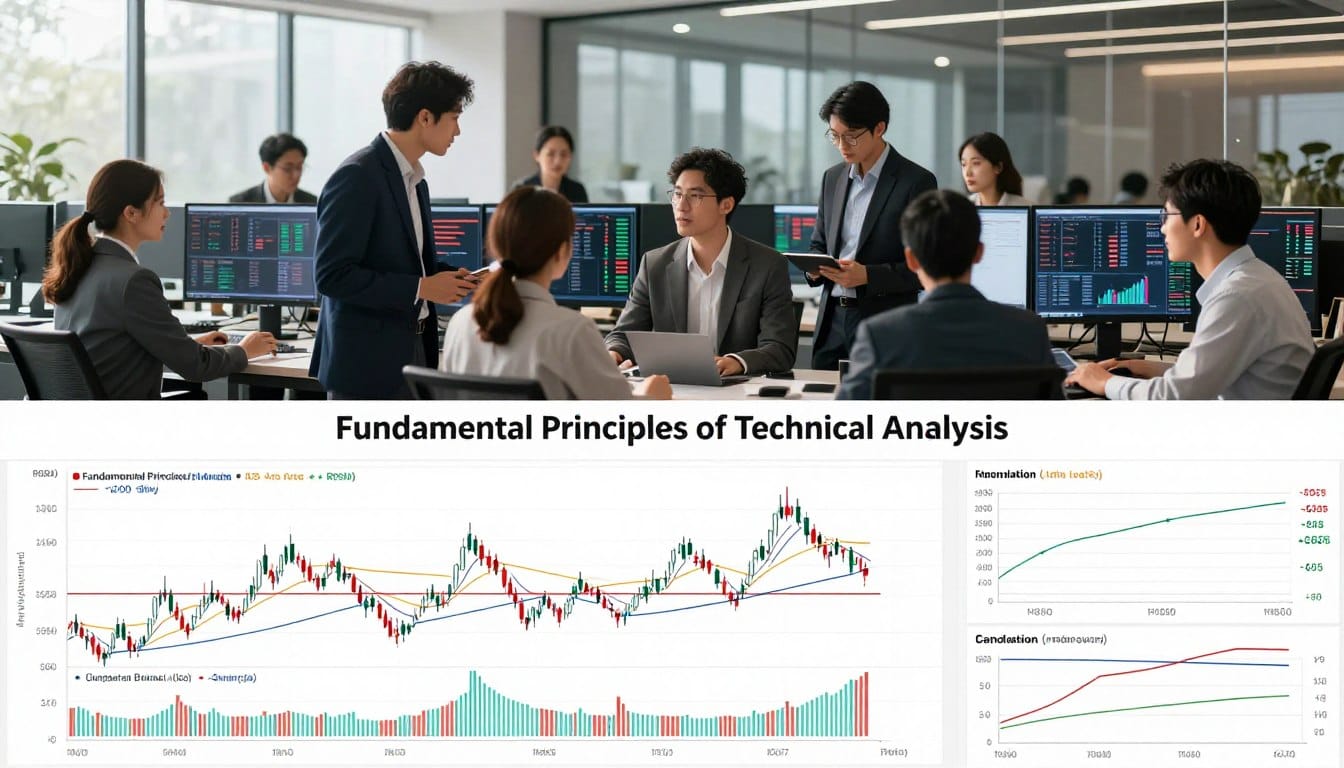
Fundamental Principles of Technical Analysis
At the heart of market movements lie three fundamental principles that every aspiring trader should grasp. These principles provide a solid foundation for understanding how prices behave in financial markets. Let’s delve into each principle to see how they influence trading decisions.
Market Price Reflects Supply and Demand
The first principle states that the current market price is determined entirely by the interplay of supply and demand. When sellers act with greater urgency than buyers, prices tend to fall. Conversely, when demand exceeds supply, prices rise. The story behind these movements often matters less than the actual dynamics at play.
For instance, during a market downturn, fear can drive sellers to sell off their stocks rapidly, causing prices to drop. In contrast, a positive earnings report can lead to increased demand, pushing prices higher. This principle emphasizes that understanding the underlying factors of supply and demand is crucial for traders.
Price Moves in Trends: Uptrends, Downtrends, and Sideways
The second principle establishes that price moves in identifiable trends. This concept, originally formalized by Charles Dow, is foundational to modern market analysis. Prices can be in an uptrend, downtrend, or sideways trend.
- Uptrends: Characterized by higher highs and higher lows, indicating that buyers are willing to purchase at progressively higher prices.
- Downtrends: Defined by lower highs and lower lows, where each rally fails to surpass the prior peak, signaling persistent selling pressure.
- Sideways Trends: Occur when prices oscillate between established support and resistance levels, often leading to a breakout.
Recognizing these trends allows traders to make informed decisions about when to enter or exit positions.
History Tends to Repeat Itself: Psychological Patterns in Markets
The third principle highlights that history tends to repeat itself in financial markets. Emotional responses—such as fear, greed, hope, and panic—remain remarkably constant across centuries of trading activity. While market history never repeats exactly, the general patterns formed by collective investor psychology create recognizable formations on price charts.
For example, chart patterns like the Head and Shoulders or Double Top often reflect how traders react to changing market conditions. Understanding these psychological patterns equips traders with the ability to anticipate future price movements based on historical behavior.
In summary, grasping these three principles is essential for anyone looking to navigate the complexities of market analysis. They provide a conceptual framework that supports the interpretation of various tools, indicators, and strategies used in trading.
| Principle | Description | Example |
|---|---|---|
| Supply and Demand | Market price reflects the balance between buyers and sellers. | Price drops when sellers outnumber buyers. |
| Price Trends | Prices move in identifiable trends: up, down, or sideways. | Higher highs in an uptrend indicate strong buying. |
| Psychological Patterns | Historical behavior of traders creates recognizable patterns. | Head and Shoulders pattern signals potential reversals. |
Essential Technical Analysis Tools and Indicators

Every trader’s toolkit should include essential indicators that guide their decisions in the market. Understanding these tools can significantly enhance your trading strategy and provide valuable insights into price movements. Below, we will explore some of the most important indicators every beginner should know.
Price Charts and Pattern Recognition
Price charts remain the foundational tool of market analysis. They allow traders to visualize price movements over time. Pattern recognition is key, as it helps identify recurring formations that have historically preceded specific price movements across different markets and timeframes.
Relative Strength Index (RSI)
The Relative Strength Index (RSI) is a momentum oscillator that measures the speed and magnitude of recent price changes on a scale from 0 to 100. Readings above 70 indicate potential overbought conditions, while readings below 30 suggest oversold conditions.
One of the most powerful signals from the RSI comes from divergences. If price action creates lower lows while the RSI forms higher lows, this bullish divergence suggests weakening downward momentum and a potential trend reversal to the upside.
Moving Average Convergence Divergence (MACD)
The Moving Average Convergence Divergence (MACD) tracks momentum by calculating the difference between the 12-period and 26-period exponential moving averages. A 9-period signal line is plotted on top to generate buy and sell crossover signals.
When the MACD line crosses above the signal line and moves from negative to positive territory, it typically indicates building bullish momentum. Conversely, a cross below the signal line into negative territory suggests increasing bearish pressure on prices.
Bollinger Bands
Bollinger Bands provide a dynamic view of volatility by plotting two standard deviation channels around a 20-period simple moving average. The bands naturally contract during periods of low volatility and expand when volatility increases.
The Bollinger Band “squeeze,” when the bands narrow significantly, often precedes a period of explosive price movement. However, it is crucial to confirm the direction of the breakout with other indicators and price action.
Approximately 90% of price action occurs within the Bollinger Bands. A breakout above the upper band does not automatically signal a short entry, especially when driven by strong fundamental catalysts like earnings surprises.
| Indicator | Description | Key Insights |
|---|---|---|
| RSI | Momentum oscillator measuring price changes. | Overbought (>70) and oversold ( |
| MACD | Tracks momentum using moving averages. | Crossovers indicate bullish or bearish momentum. |
| Bollinger Bands | Volatility indicator with standard deviation channels. | Narrow bands signal potential price movements. |
Common Chart Patterns Every Beginner Should Know

Every aspiring trader should familiarize themselves with the essential chart patterns that signal market movements. These patterns are crucial for predicting future price trends and understanding market psychology. Below, we will explore some of the most reliable patterns that every beginner should learn to identify.
Head and Shoulders & Inverse Head and Shoulders
The Head and Shoulders pattern is widely regarded as one of the most reliable trend reversal signals. It features a central peak (the head) flanked by two lower peaks (the shoulders). When the price breaks below the neckline, which connects the lows between the peaks, it confirms a transition from an uptrend to a downtrend.
A notable example occurred in Tesla (TSLA) stock between January 7th and January 22nd, 2021. After completing the Head and Shoulders pattern, the stock price fell nearly 25% following the neckline break.
Conversely, the Inverse Head and Shoulders pattern indicates a reversal from a downtrend to an uptrend. This formation consists of a central trough with two shallower lows on either side. A breakout above the neckline signals a strong upward momentum. Autodesk (ADSK) demonstrated this pattern between September 8th and October 9th, 2021, leading to approximately 40% price appreciation.
Double Top and Double Bottom
The Double Top pattern signals a reversal from an uptrend to a downtrend. It forms when the price rallies to a resistance level, pulls back, and then attempts to break through that resistance again but fails. This creates two peaks at similar price levels before breaking below the support level. Nike (NKE) exhibited a clear Double Top formation from November 5th to December 13th, 2021, with resistance near $177.50.
On the other hand, the Double Bottom pattern is the bullish counterpart. It features two distinct lows at similar price levels that establish a strong support zone. Once the price breaks above the intervening resistance, it initiates a new uptrend. Microsoft (MSFT) formed a Double Bottom around $239 between May 12th and June 4th, 2021, which led to a sustained uptrend after breaking through the $247 resistance level.
Additional Patterns to Watch For
Beyond the Head and Shoulders and Double Top/Bottom patterns, beginners should also familiarize themselves with continuation patterns such as flags, pennants, and cup and handle formations. These patterns indicate that the prevailing trend is likely to resume after a brief consolidation period.
| Pattern | Description | Signal |
|---|---|---|
| Head and Shoulders | Three peaks: one higher (head) and two lower (shoulders). | Trend reversal from uptrend to downtrend. |
| Inverse Head and Shoulders | Three troughs: one lower (head) and two higher (shoulders). | Trend reversal from downtrend to uptrend. |
| Double Top | Two peaks at similar price levels. | Trend reversal from uptrend to downtrend. |
| Double Bottom | Two troughs at similar price levels. | Trend reversal from downtrend to uptrend. |
Technical Analysis vs. Fundamental and Quantitative Analysis
Understanding the distinctions between various analysis methods is crucial for traders seeking to refine their strategies. Each approach offers unique insights into market behavior, which can significantly influence trading decisions.
Key Differences with Fundamental Analysis
Fundamental analysis evaluates a company’s intrinsic value by examining financial statements, earnings reports, and management quality. It focuses on factors like dividends and competitive positioning to determine whether a stock is overvalued or undervalued.
In contrast, technical analysis emphasizes price charts and market data. It operates on the premise that all known fundamental information is already reflected in the current market price through the actions of buyers and sellers. This approach allows traders to gauge market psychology and identify potential trends.
Relationship and Overlaps with Quantitative Analysis
The relationship between technical and quantitative analysis is nuanced. Quantitative analysis employs mathematical and statistical models to test and automate trading strategies. While some practitioners view these methods as synonymous, others see clear distinctions.
Notably, Paul Wilmott, a quantitative analysis expert, argues that pure technical analysis often lacks predictive power. However, many successful traders incorporate elements of both to enhance their strategies.
Benefits of Combining Analysis Methods
Many traders find value in combining different analysis methods. John Bollinger coined the term “rational analysis” to describe the intersection of technical and fundamental analysis. This integrated approach can enhance decision-making by capturing the strengths of both frameworks.
Fusion analysis overlays fundamental metrics with technical timing signals. This methodology aims to improve portfolio performance by identifying high-quality stocks while determining optimal entry and exit points.
For beginners, understanding the strengths and limitations of each analytical approach enables more informed decision-making. This knowledge can help develop a personalized trading methodology that aligns with individual goals, risk tolerance, and time horizons.
How to Develop Your Own Trading Strategy Using Technical Analysis
A well-defined trading strategy serves as a roadmap for traders, guiding their decisions in a dynamic market. To build a successful strategy, it is crucial to establish clear entry and exit points, utilize multiple indicators for confirmation, and implement effective risk management techniques.
Setting Entry and Exit Points
Developing a personal trading strategy begins with defining clear entry and exit rules based on specific signals. These can include a moving average crossover, an RSI reading crossing a threshold, or a chart pattern completion at a recognized support or resistance level.
Entry points should be identified at levels where multiple technical factors converge. For example, a bullish candlestick pattern forming at a key support level while the RSI shows an oversold reading and the MACD generates a buy signal can be a strong indicator.
Using Multiple Indicators for Confirmation
Professional traders consistently emphasize that setups confirmed by three to five independent indicators have a statistically higher probability of success. Relying on only one or two signals may lead to false signals and market noise.
By integrating various indicators, traders can filter out unreliable signals and enhance their decision-making process. This approach not only strengthens the validity of the trade but also builds confidence in executing the strategy.
Risk Management and Setting Stop Losses
Risk management forms the foundation of any sustainable trading strategy. Stop losses should be placed at levels that invalidate the original trade thesis. Typically, this means positioning them just below recent swing lows for long positions or above swing highs for short positions.
Position sizing is also crucial. Traders should ensure that no single trade risks more than a small percentage of their total capital. This practice helps to protect the account from significant losses due to a series of losing trades.
Additionally, the time component of a trading strategy must align with personal circumstances. Day traders often focus on intraday charts, while swing traders may hold positions for days or weeks based on daily and weekly analysis.
Backtesting a strategy against historical market data can validate its effectiveness before risking real capital. However, traders must be cautious of over-optimization, which may produce impressive historical results but fail in live market conditions.
The New York Institute of Finance curriculum teaches students how to systematically design, test, and refine trading strategies using popular indicators. Successful strategies evolve over time, requiring ongoing analysis and adjustments while remaining grounded in the principles of sound risk management.
Learning Resources and Courses to Master Technical Analysis
Embarking on the journey of mastering market techniques requires access to quality resources. Numerous educational platforms and materials can guide you in honing your skills. Here, we will explore some of the best options available for beginners eager to deepen their understanding of market analysis.
Overview of the New York Institute of Finance Course
The New York Institute of Finance (NYIF) offers a comprehensive course titled “Trading – Fundamentals of Technical Analysis.” Established over a century ago by the New York Stock Exchange, NYIF is a global leader in financial education. This course covers essential topics, including:
- Using technical indicators such as moving averages, RSI, and MACD.
- Designing effective trading strategies and evaluating their results.
- Understanding sentiment analysis and market breadth indicators.
- Exploring advanced theories like Elliott Wave and Fibonacci sequences.
Upon completion, students earn a Certificate in Trading – Fundamentals of Technical Analysis, recognized worldwide.
Online Platforms and Tools for Practice
Another excellent resource is TradingView.com, a premier online platform for practicing market analysis. This site offers:
- Advanced candlestick charting capabilities.
- Hundreds of built-in indicators for detailed analysis.
- A collaborative community where traders can share insights.
Beginners can experiment with different timeframes and save chart layouts, all within a user-friendly interface.
Books, Tutorials, and Communities to Join
In addition to formal courses and platforms, several books and communities can enhance your learning experience. One highly recommended book is Technical Analysis of Stock Trends by Robert D. Edwards and John Magee. This seminal work, first published in 1948, is still widely used by professional analysts today.
Joining professional organizations such as the CMT Association or the International Federation of Technical Analysts (IFTA) can provide networking opportunities and continuing education. Online forums and trading communities also allow beginners to discuss ideas and learn from experienced traders.
A structured learning path that combines formal coursework, hands-on practice, and community engagement provides the most efficient route to mastering market techniques.
| Resource Type | Description | Key Benefits |
|---|---|---|
| NYIF Course | Comprehensive technical analysis training. | Earn a globally recognized certificate. |
| TradingView | Online platform for charting and analysis. | Access to community insights and various indicators. |
| Books | Seminal texts on market analysis. | Deepen understanding of key concepts and strategies. |
Using Technical Analysis Responsibly: Risks and Best Practices
Engaging with market analysis requires a responsible approach to ensure long-term success. While this method offers valuable insights, it is essential to recognize its limitations and potential pitfalls.
One major concern is that no pattern, indicator, or strategy guarantees 100% accuracy. The efficient-market hypothesis suggests that stock prices are inherently unpredictable. Thus, relying solely on past price data to forecast future movements can be misleading.
Limitations and Criticisms of Technical Analysis
Academic research on this subject has produced mixed results. Out of 95 modern studies, about 56 found positive evidence supporting technical trading rules. However, issues like data-snooping bias raise questions about reproducibility in the findings.
Additionally, a Federal Reserve working paper indicated that support and resistance levels could predict intraday trend interruptions in short-term foreign exchange markets. This lends some credibility to core technical concepts, yet their effectiveness can vary significantly across different markets.
Another critical factor is transaction costs. Even minor commissions and slippage can diminish or negate potential profits suggested by backtested strategies, especially in high-frequency momentum trading.
Importance of Backtesting and Paper Trading
Backtesting is a crucial step before committing real capital. This process involves applying a trading strategy to historical market data, allowing traders to evaluate how their approach would have performed under various conditions.
However, only fully algorithmic indicators can be rigorously backtested. Strategies relying on subjective human interpretation require manual review, making them harder to validate statistically.
Paper trading, or simulated trading without financial risk, serves as an invaluable intermediate step. It allows beginners to practice their strategies and build confidence without the pressure of real money at stake.
Maintaining Emotional Discipline in Trading
Emotional discipline is perhaps the most underappreciated aspect of successful market analysis. Fear can lead traders to exit winning positions prematurely, while greed may cause them to hold onto losing trades beyond logical stop-loss levels.
The psychological patterns that make this approach effective can also undermine individual traders. Maintaining objectivity and adhering to predetermined trading plans is essential for success.
Responsible use of market analysis involves continuous education, honest assessments of trading results, and the humility to accept that losses are an inevitable part of trading. Proper position sizing and risk controls are vital for managing these challenges effectively.
Conclusion
By finishing this guide, you now possess the foundational knowledge necessary to approach market opportunities with confidence. This comprehensive overview has introduced essential concepts of market analysis, including the principles of supply and demand, trend identification, and the practical application of indicators.
Remember, this approach is not about predicting the future with certainty but about recognizing high-probability opportunities based on observable data. Focusing on price charts allows traders to make more objective decisions, enhancing their trading strategies.
Mastering key tools such as candlestick patterns and essential indicators will equip you to interpret market psychology effectively. Continuous education through reputable institutions and platforms will further sharpen your skills.
As you embark on your trading journey, embrace the importance of disciplined risk management and emotional control. With dedication to the principles outlined in this guide, you can build a solid foundation for navigating the market with greater confidence and competence.

 By
By